Eighth Years RR Run Club
Eighth Season for RunRite
Let’s review this year of RunRite in graphs and data, and let’s try to answer a few questions such as:
- How long did we run?
- What was the longest run?
- Where did we run?
- Why did we run?
I’m collecting data for all runs, so each Thursday I’m archiving the path of the week (a .gpx file). It changes each week except that we start and come back from and to the same place. And for the last 3 to 4 years we started from Espace Ciele.
We will go up, reach the top of Westmount or Mt-Royal or both depending of how the front of the pack feels it. We run 9 to 13km each time at least.
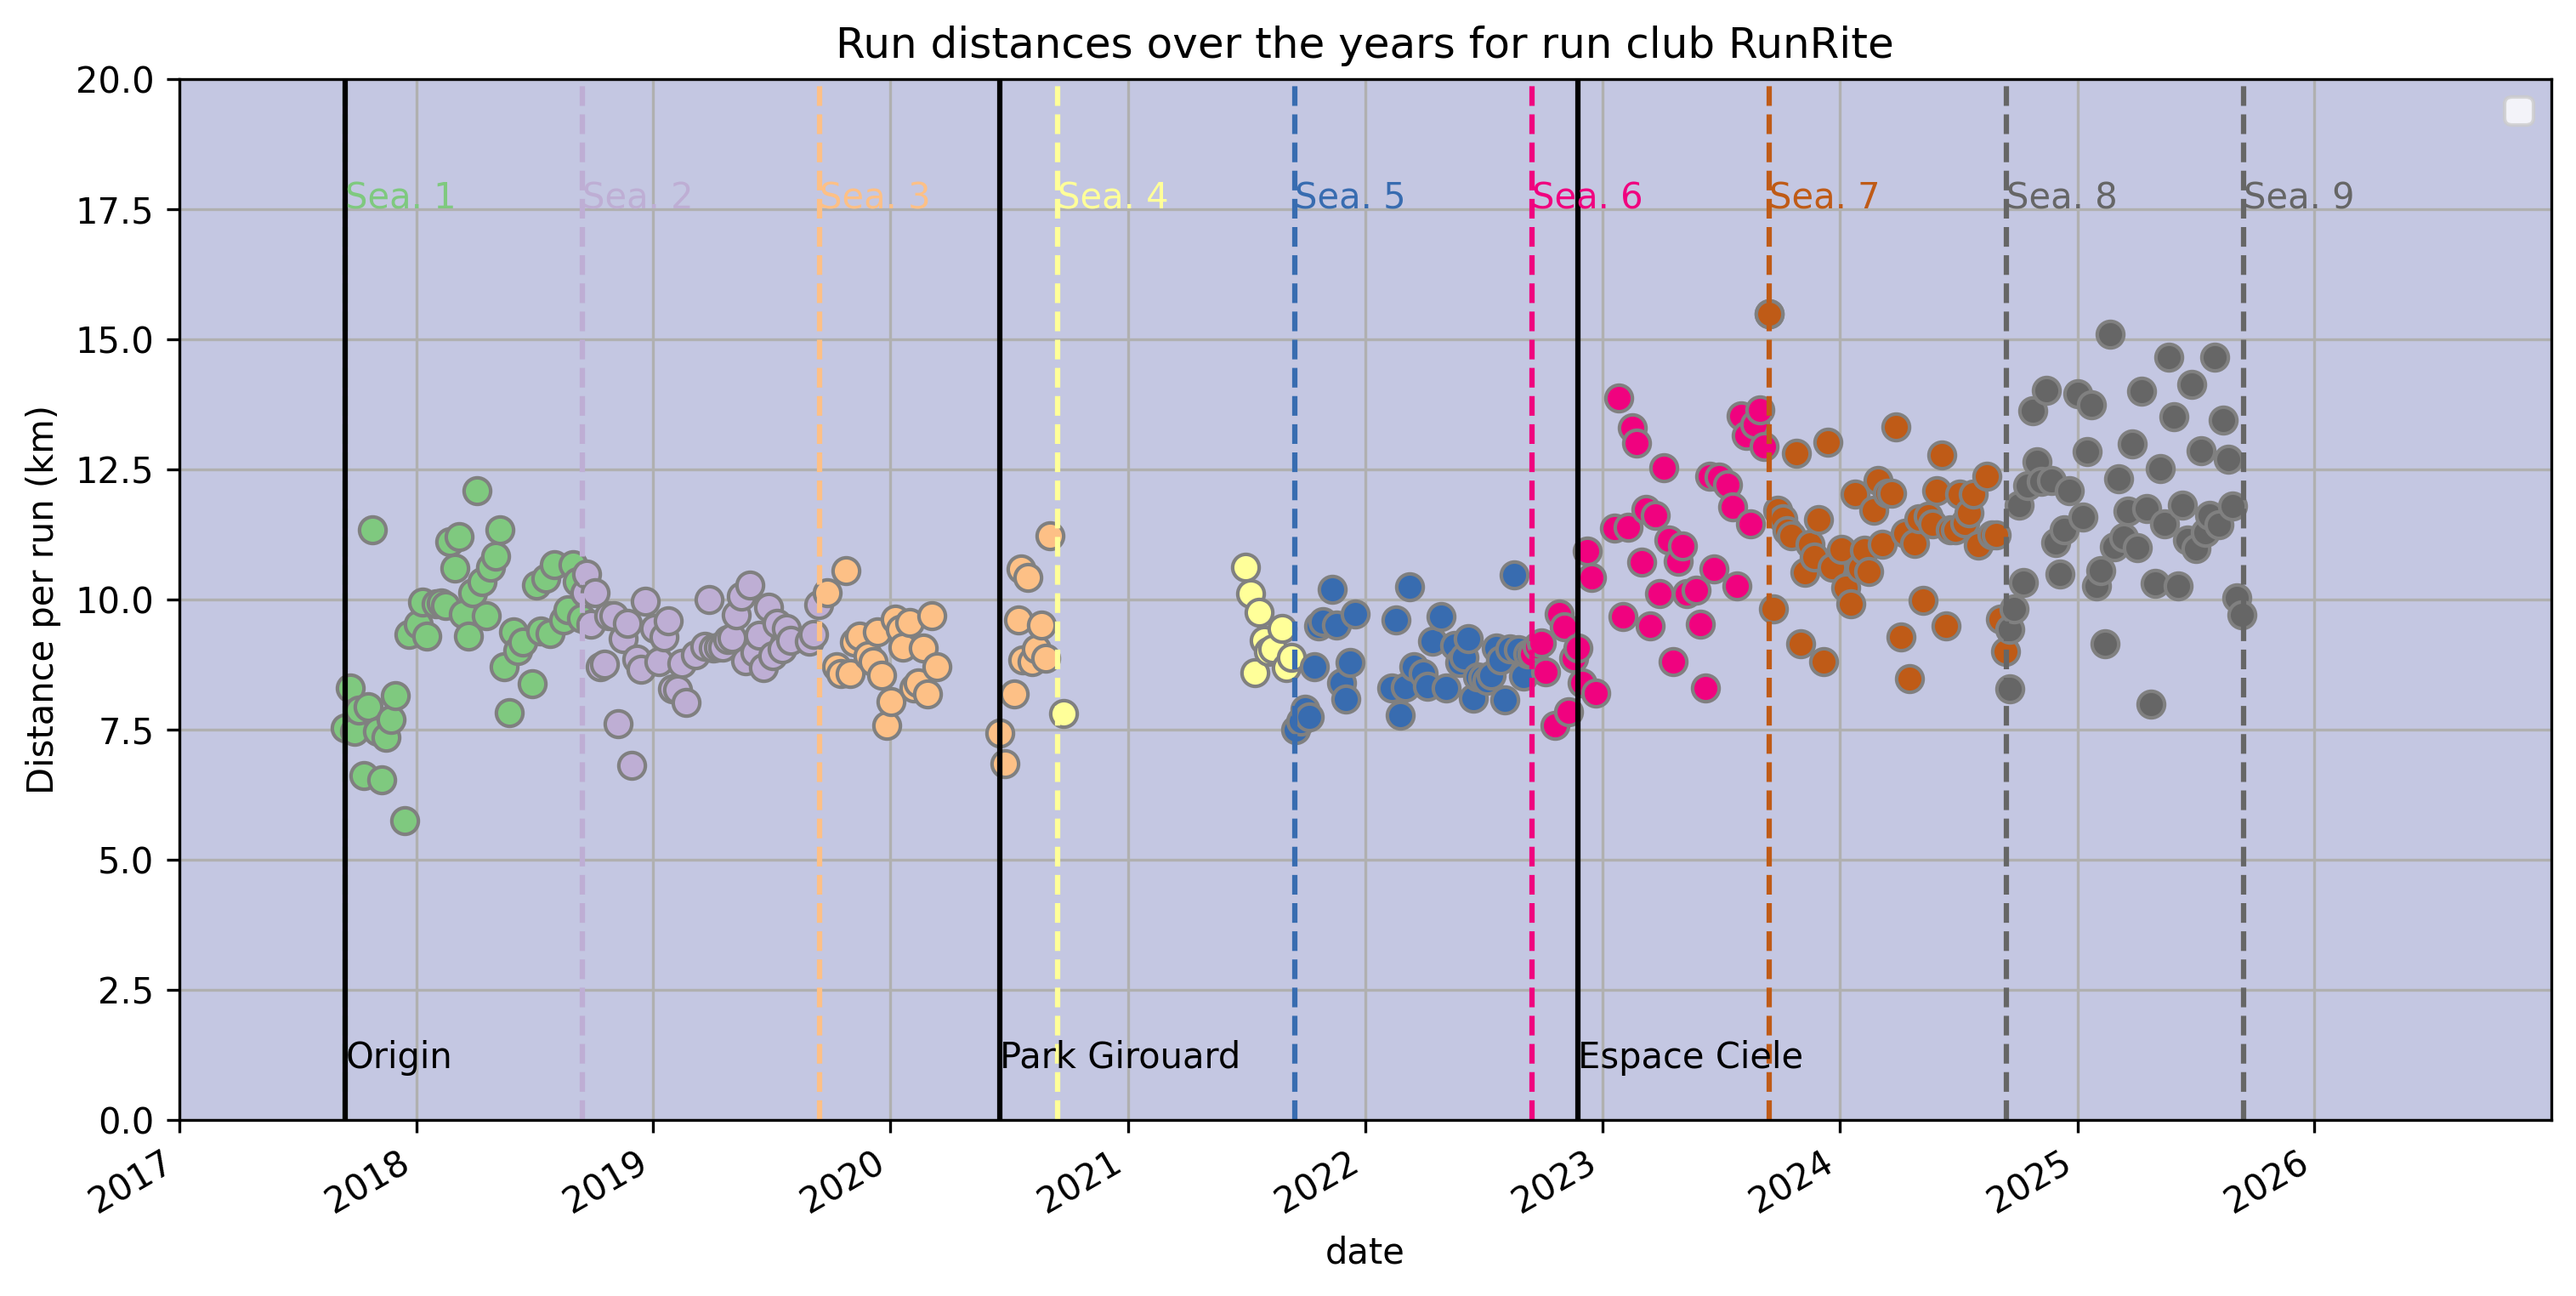
How long did we run?
A graph showing the run distances per run since the beginning of RunRite.
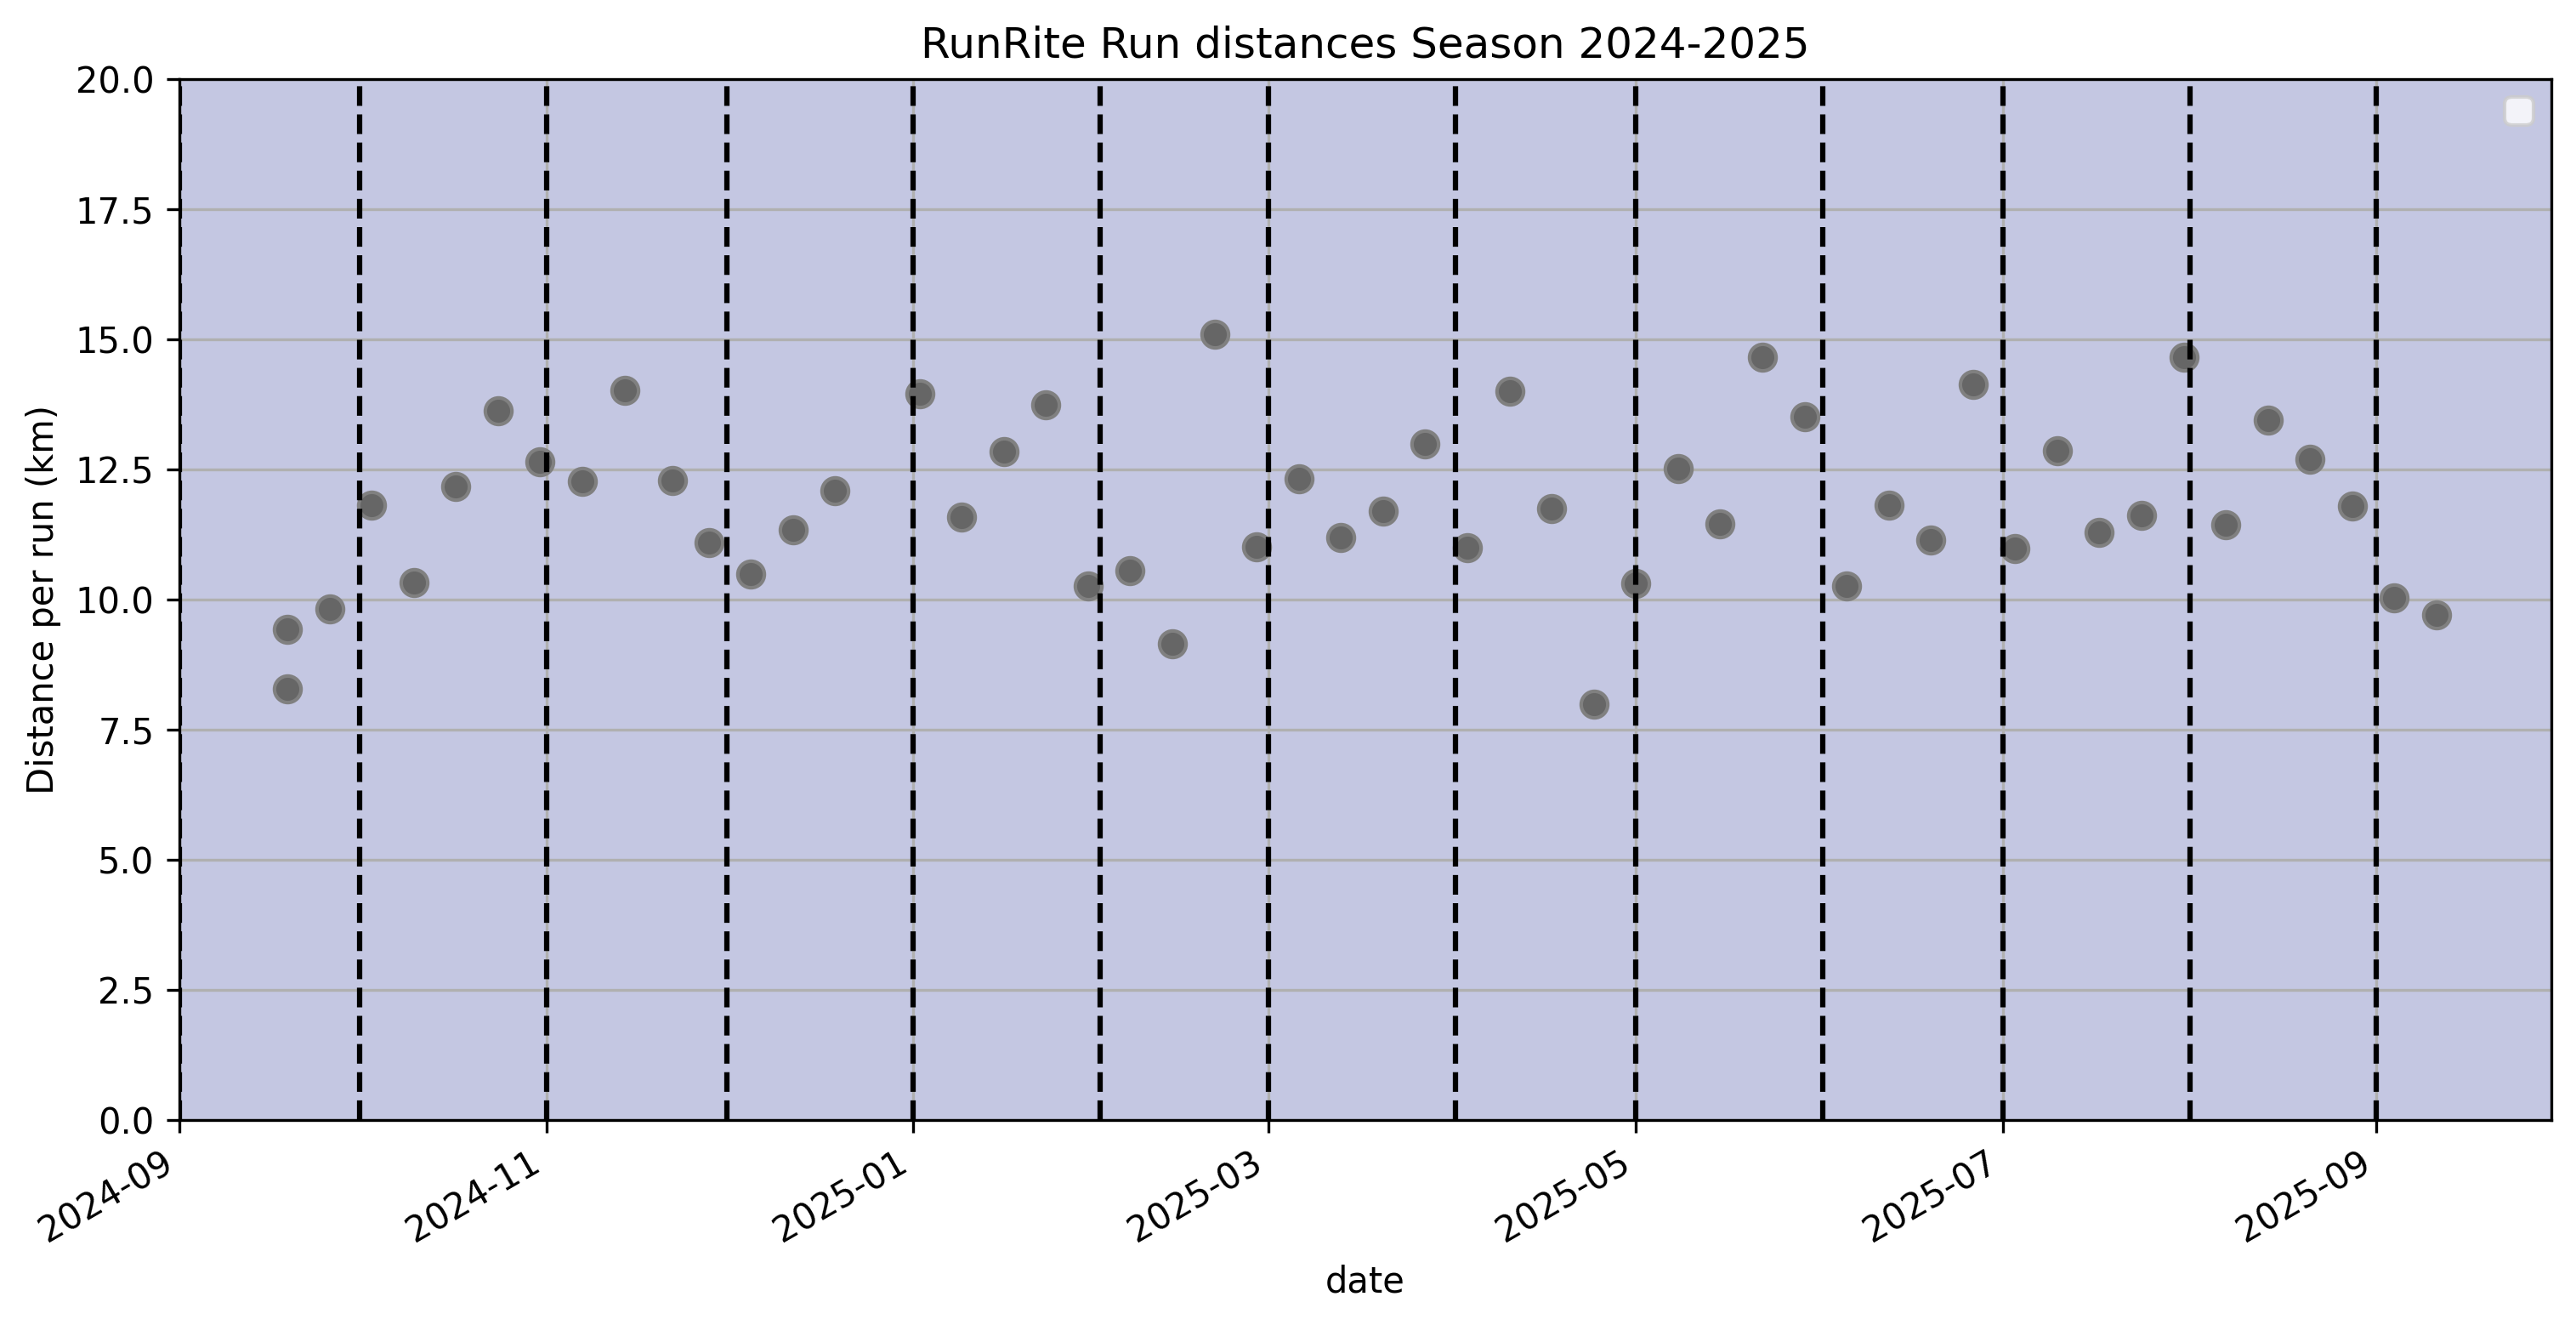
Same graph as above but only focusing on season 2024-2025, interesting to see some kind of periodicity.
How did I produce those graphs?
I use Python and jupyter notebook, modules to read gpx files, geopandas to display those gpx traces.
Since my first posts about analyzing those data I re-organized many times how I store my data, from combined Python DataFrame, to list, to csv files… I was looking for a solution to combine in one element all the runs with distances, date and gps traces… The one element being my database (or DB). It is usually what takes the biggest amount of time in those analysis, to prepare your data, build the DB for easier access to inside information.
So after finally understanding how geopandas works I switched to geoDataFrame to create my DB, and each line of my geoDataFrame stores data of one run:
gdf_dataset.describe()
which returns this:
file_name	cumulative_distance	geometry
count	331	331	331
unique	331	329	329
top	RunRite_2017_09_14.gpx	10.673277359950822	LINESTRING (-73.619509 45.466079, -73.619525 4...
freq	1	2	2
where the geometry column stores xyz elements that can be easily displayed on a map.
gdf_dataset.head()
which returns this:
file_name	cumulative_distance	geometry
date
2017-09-14	RunRite_2017_09_14.gpx	7.529637309088577	LINESTRING (-73.61934 45.46564, -73.61935 45.4...
2017-09-21	RunRite_2017_09_21.gpx	8.300300892761458	LINESTRING (-73.61956 45.46604, -73.6196 45.46...
2017-09-28	RunRite_2017_09_28.gpx	7.461594431938719	LINESTRING (-73.6195 45.46597, -73.61973 45.46...
2017-10-05	RunRite_2017_10_05.gpx	7.874011925908547	LINESTRING (-73.6194 45.46598, -73.61939 45.46...
2017-10-12	RunRite_2017_10_12.gpx	6.611274599745979	LINESTRING (-73.61969 45.46605, -73.61972 45.4...
the five first element of my DB. The index of the DB is based on date. There file_name column, cumulative_distance column and finally geometry column. Because it is a geoDataFrame it already contains the type of map projection information for ploting the gps traces on a graph.
Now I can ask questions to my DB.
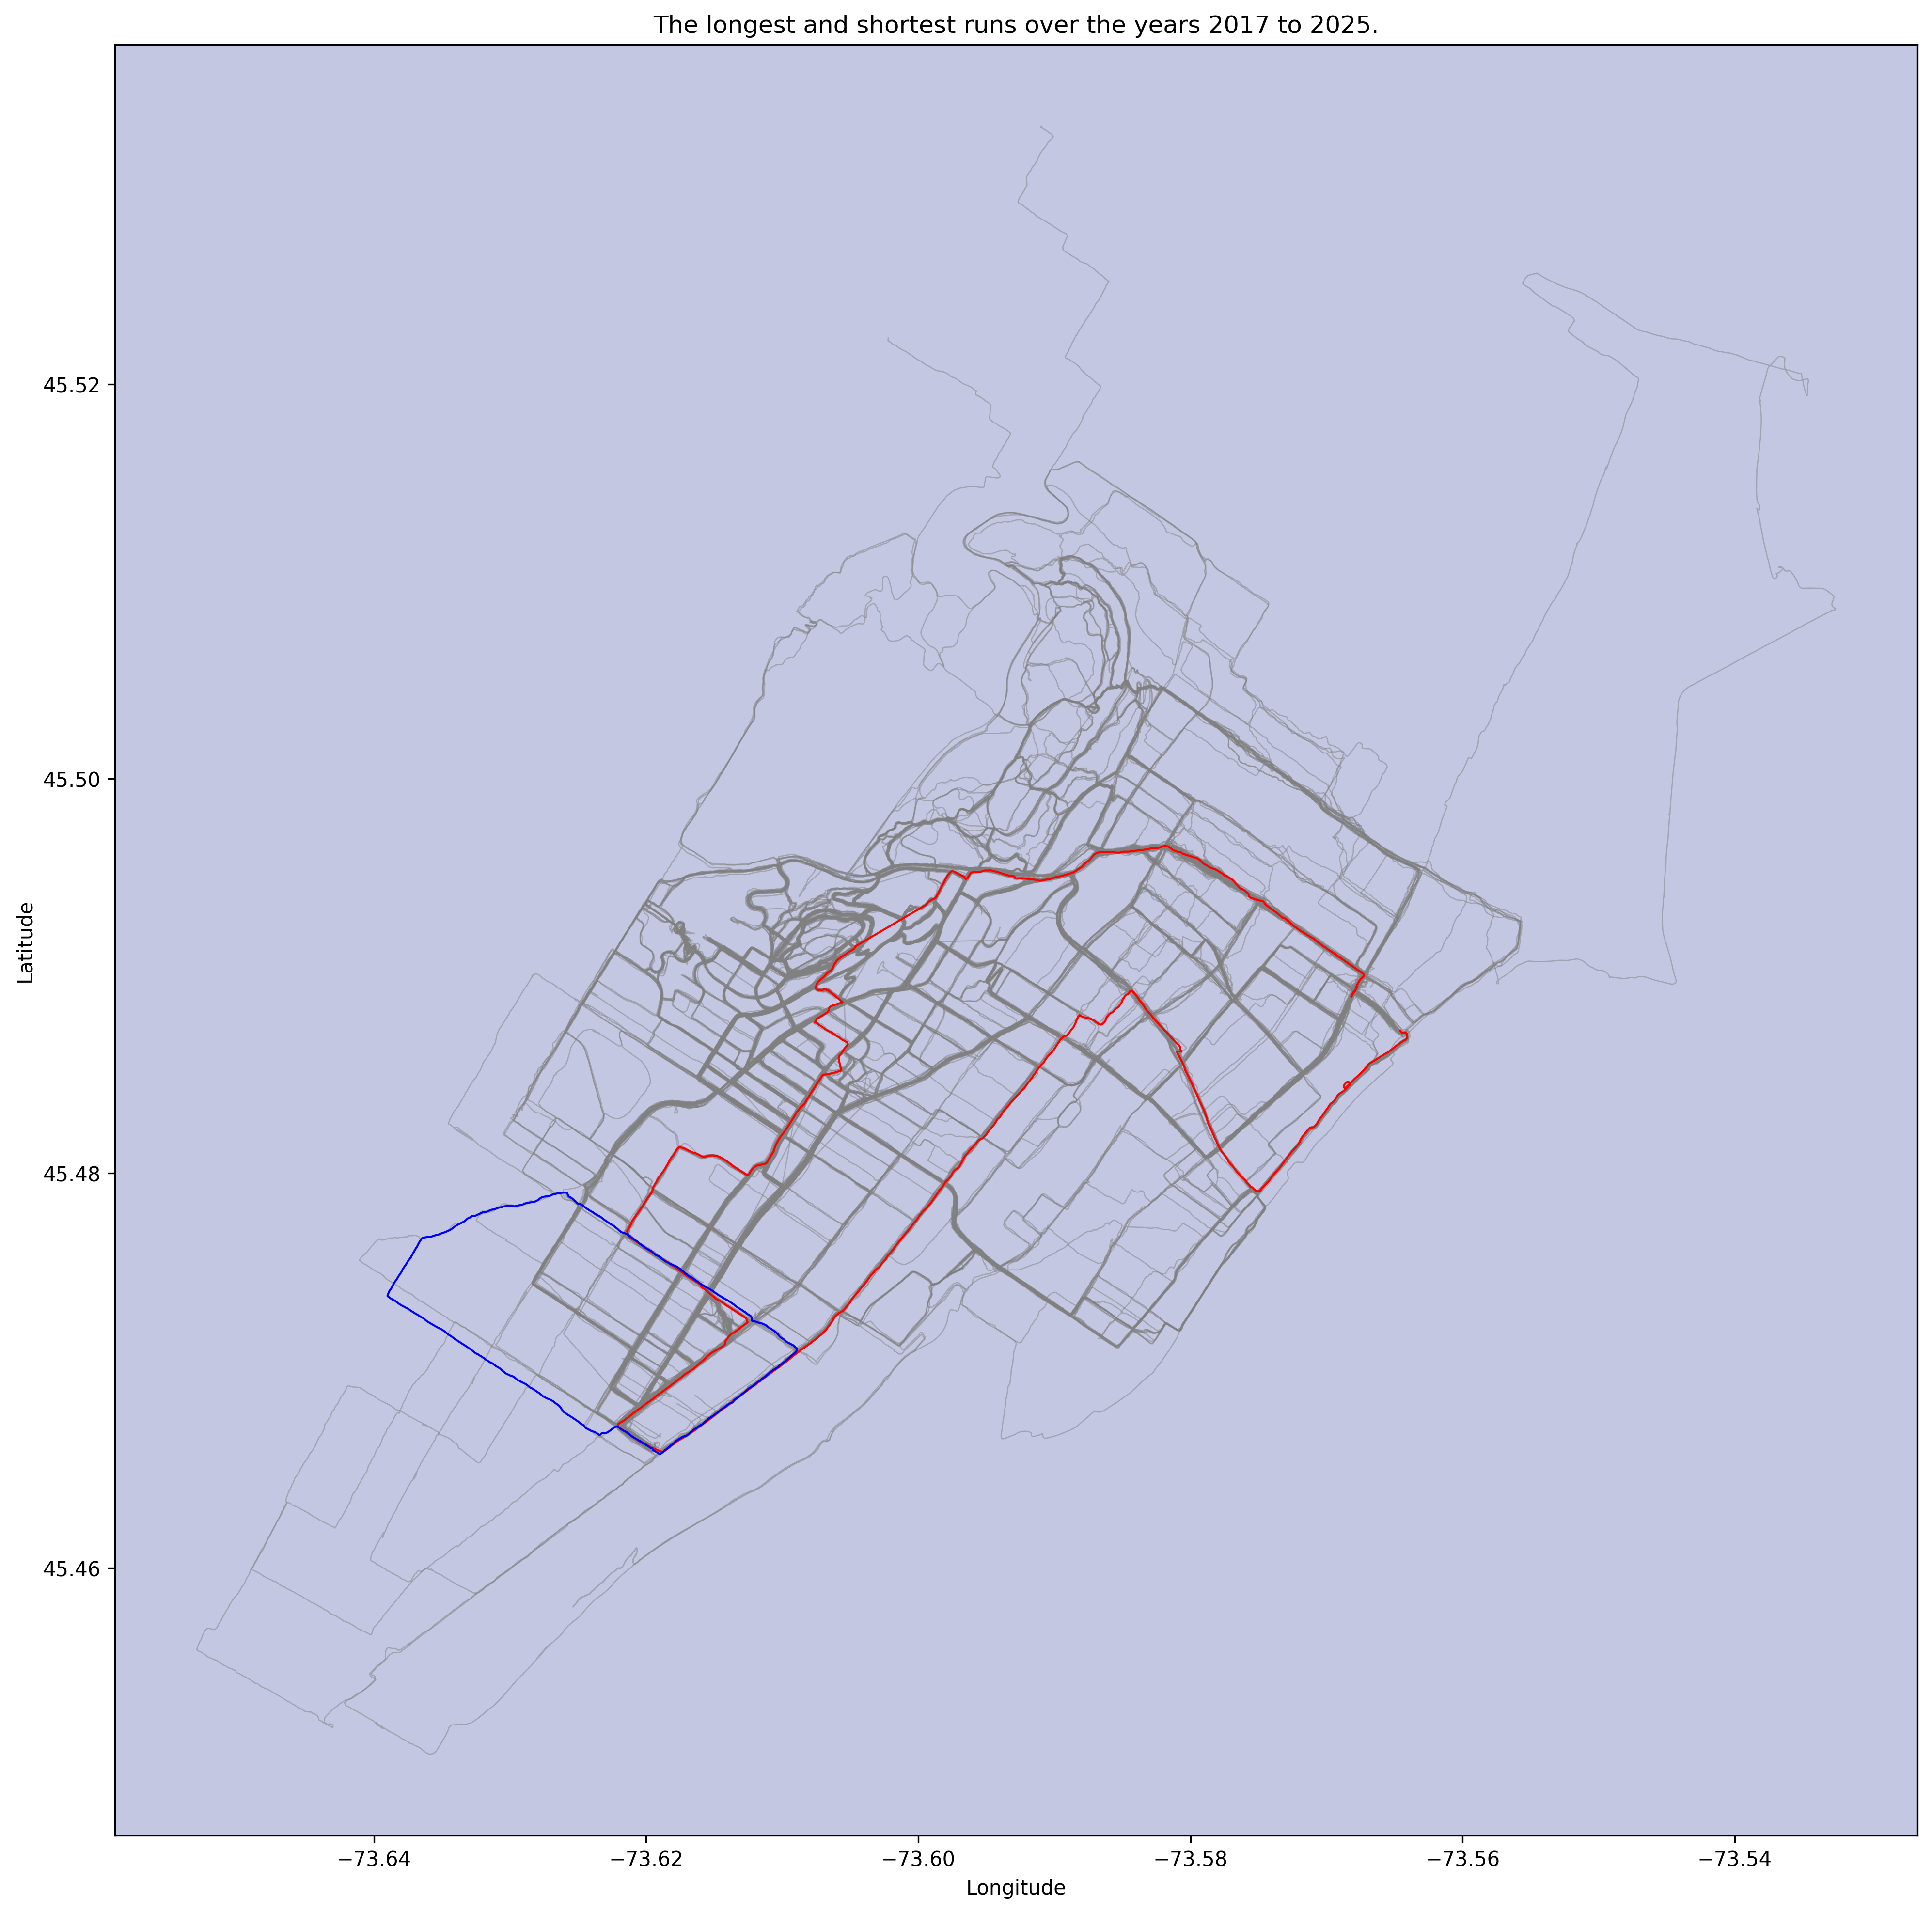
What are the longest and shortest runs?
print("Date of the longest run:", df_dataset['cumulative_distance'].idxmax())
print("Date of the shortest run:", df_dataset['cumulative_distance'].idxmin())
which returns:
Date of the longest run: 2023-09-14 00:00:00
Date of the shortest run: 2017-12-14 00:00:00
and now if we want to display the corresponding distances:
print("Distance of the longest run: {0:1.2f}km.".format(df_dataset.loc["2023-09-14"]['cumulative_distance']))
print("Distance of the shortest run: {0:1.2f}km.".format(df_dataset.loc["2017-12-14"]['cumulative_distance']))
which returns:
Distance of the longest run: 15.49km.
Distance of the shortest run: 5.75km.
The graph below hightlights in red and blue the longest and shortest runs of the run club. We can see that the shortest one was when the club was starting its run from NDG, and the longest one (as of today middle of September 2025) was starting from the actual meeting point at Espace Ciele. The shortest one was probably a very flat run looking at the path followed avoiding Summit Circle or the St-Joseph oratoire.
What is the cumulated distance of all runs since its beginning???
run_dist_cumulated = gdf_dataset.cumulative_distance.astype("float").sum()
year_start = gdf_dataset.index[0].year
year_now   = gdf_dataset.index[-1].year
print("Total distance ran over the years from {1:1.0f} to {2:1.0f} is is {0:1.0f}km.".format(run_dist_cumulated,year_start,year_now))
which returns this:
Total distance ran over the years from 2017 to 2025 is is 3333km.
Of course there is some errors in those numbers. I have collectec many gps traces from many different sensors, and therefore there are some variations. I will say in a complete empirically approach that there is 5% marge of error in those km displayed.
Where did we run?
Below the code I use to create the figure displayed after those lines:
fig, ax = plt.subplots(1, 1, figsize=(16,16))
# display all the runs
gdf_dataset.plot(ax=ax,linewidth=0.6, color='gray', alpha=0.5)
# display the runs of this 8th year in black
gdf_dataset.loc["2024-09-14":"2025-09-13",:].plot(ax=ax,linewidth=1, color='black')#'#88B04B')
ax.set_facecolor('#C4C7E2')
ax.set_xlabel('Longitude')
ax.set_ylabel('Latitude')
ax.set_title('Run paths RunRite 8th season')
ax.axis("tight");
Graph showing where we did go during the year 2024-2025.
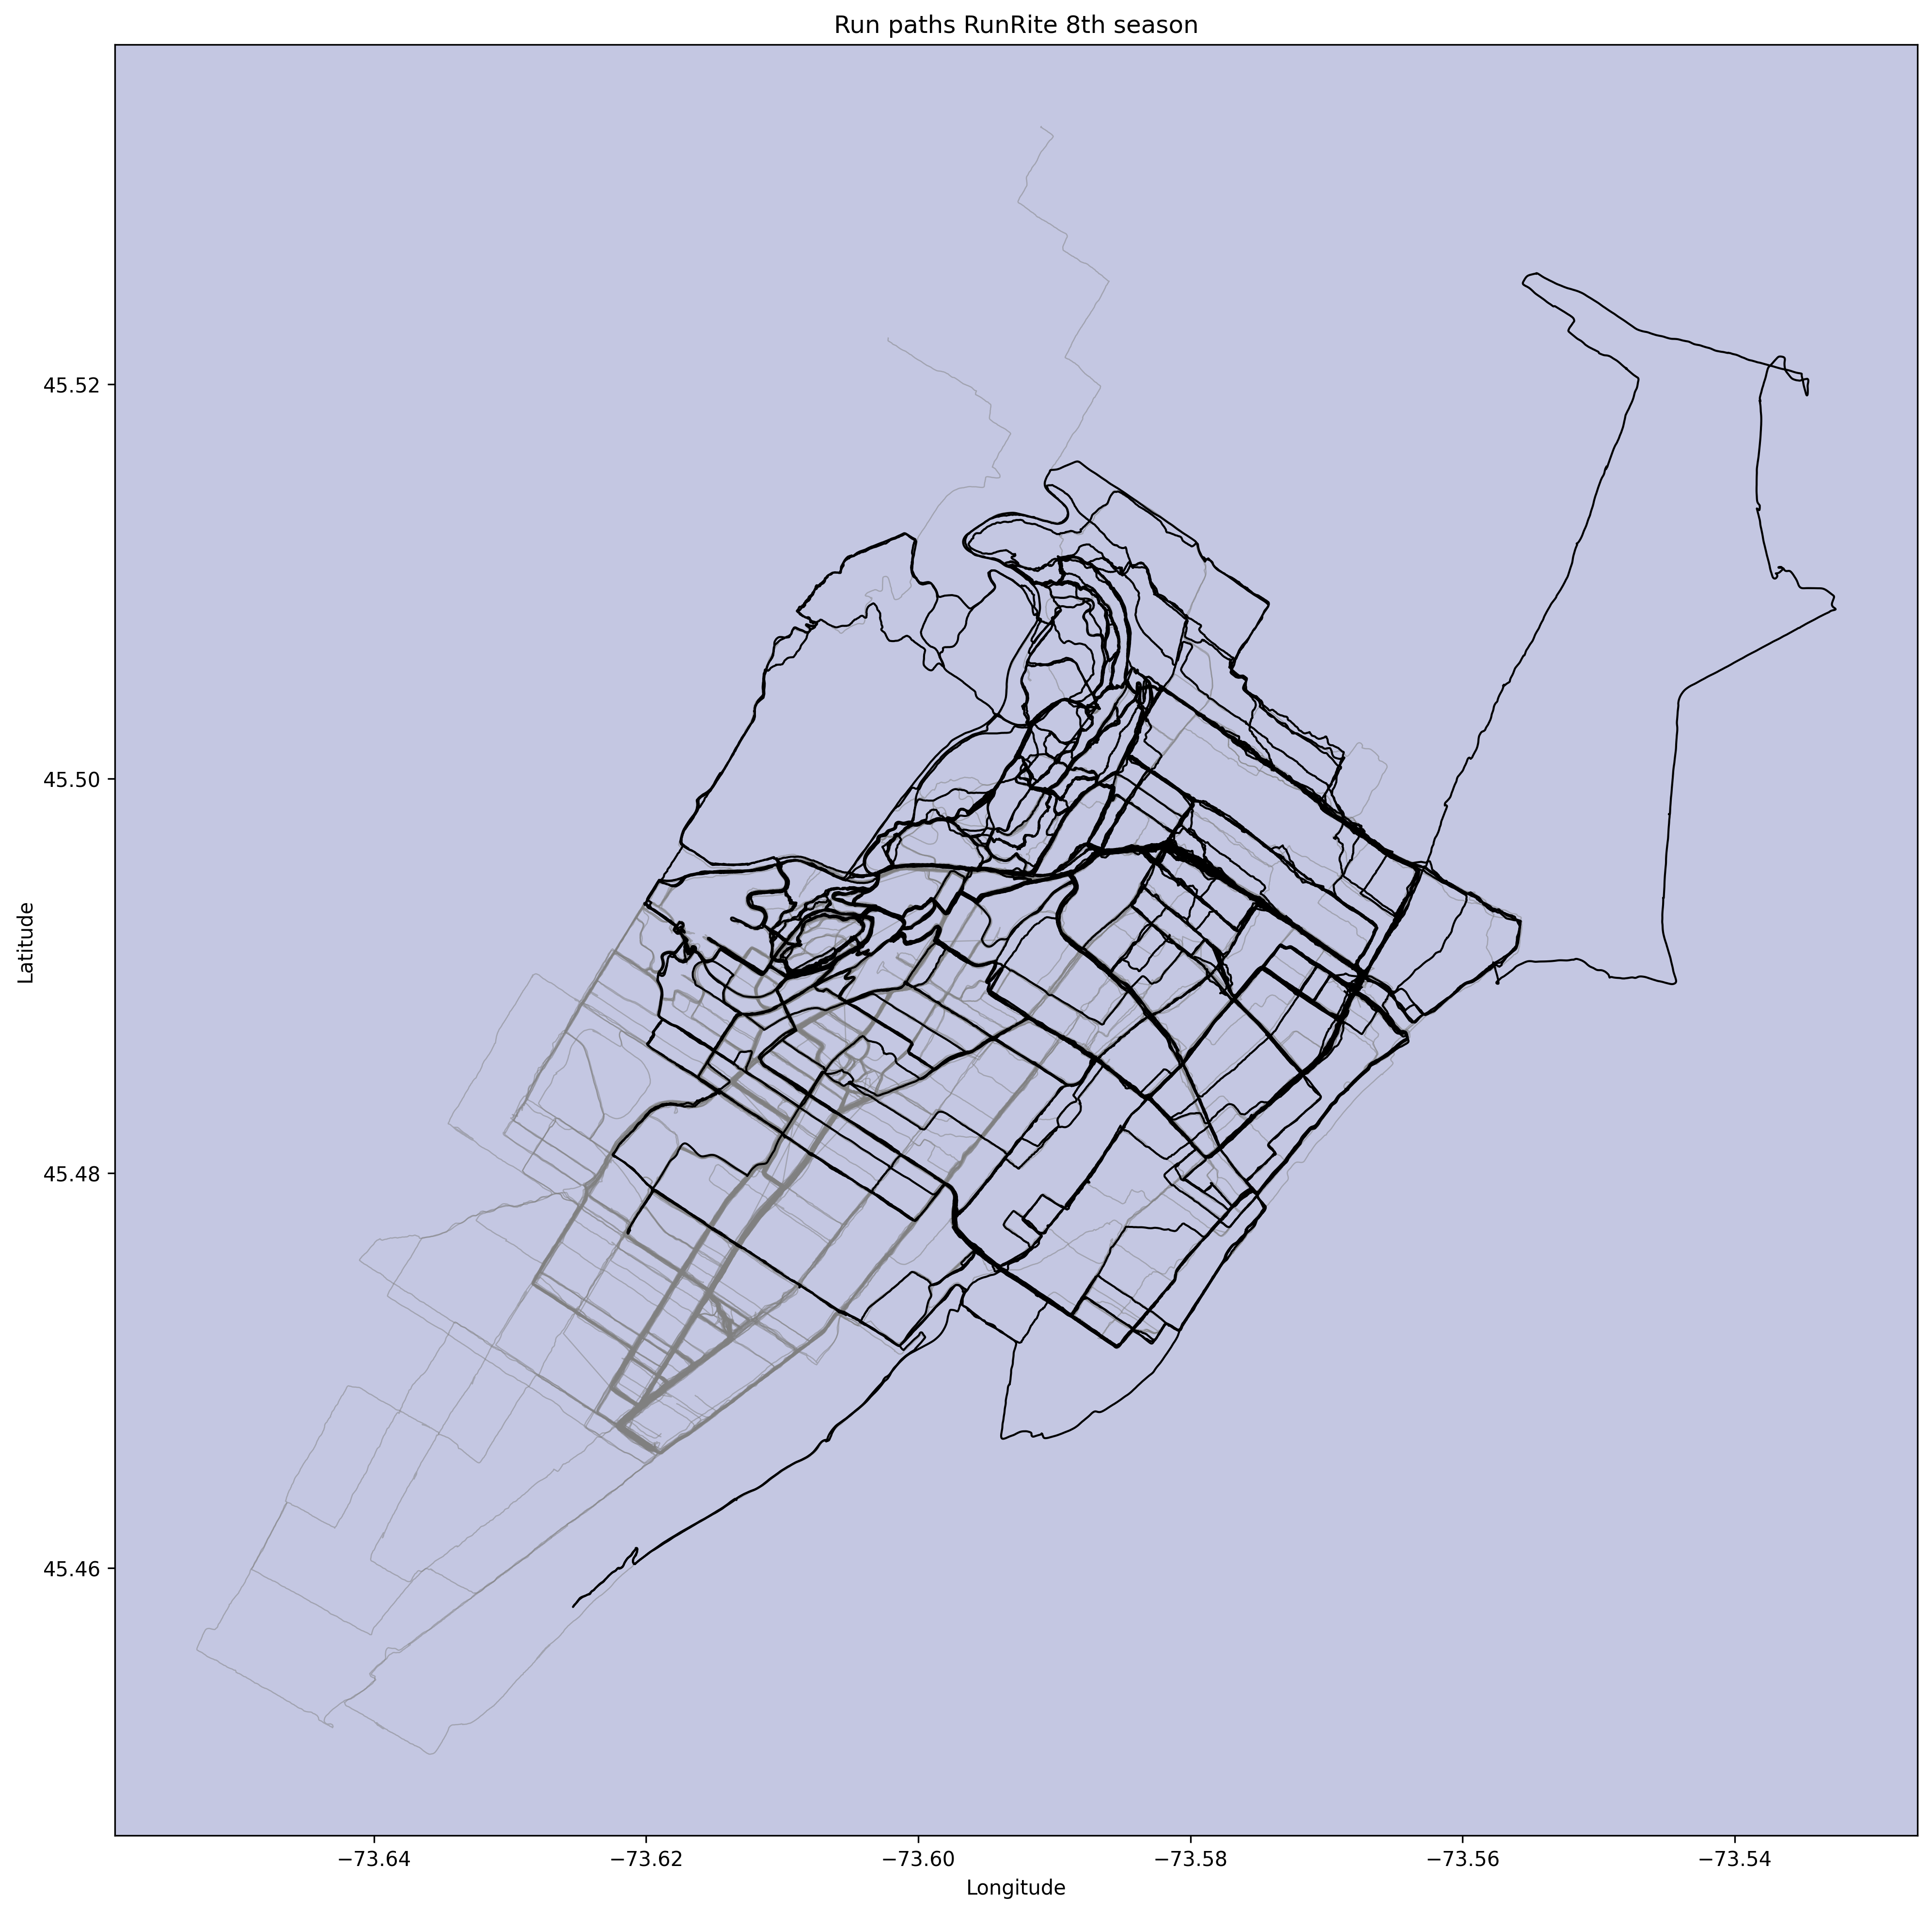
Saddly I wasn’t in Montreal the Thursday the group did go East, took the Jacques Cartier bridge and came back by the Parc Jean-Drapeau.
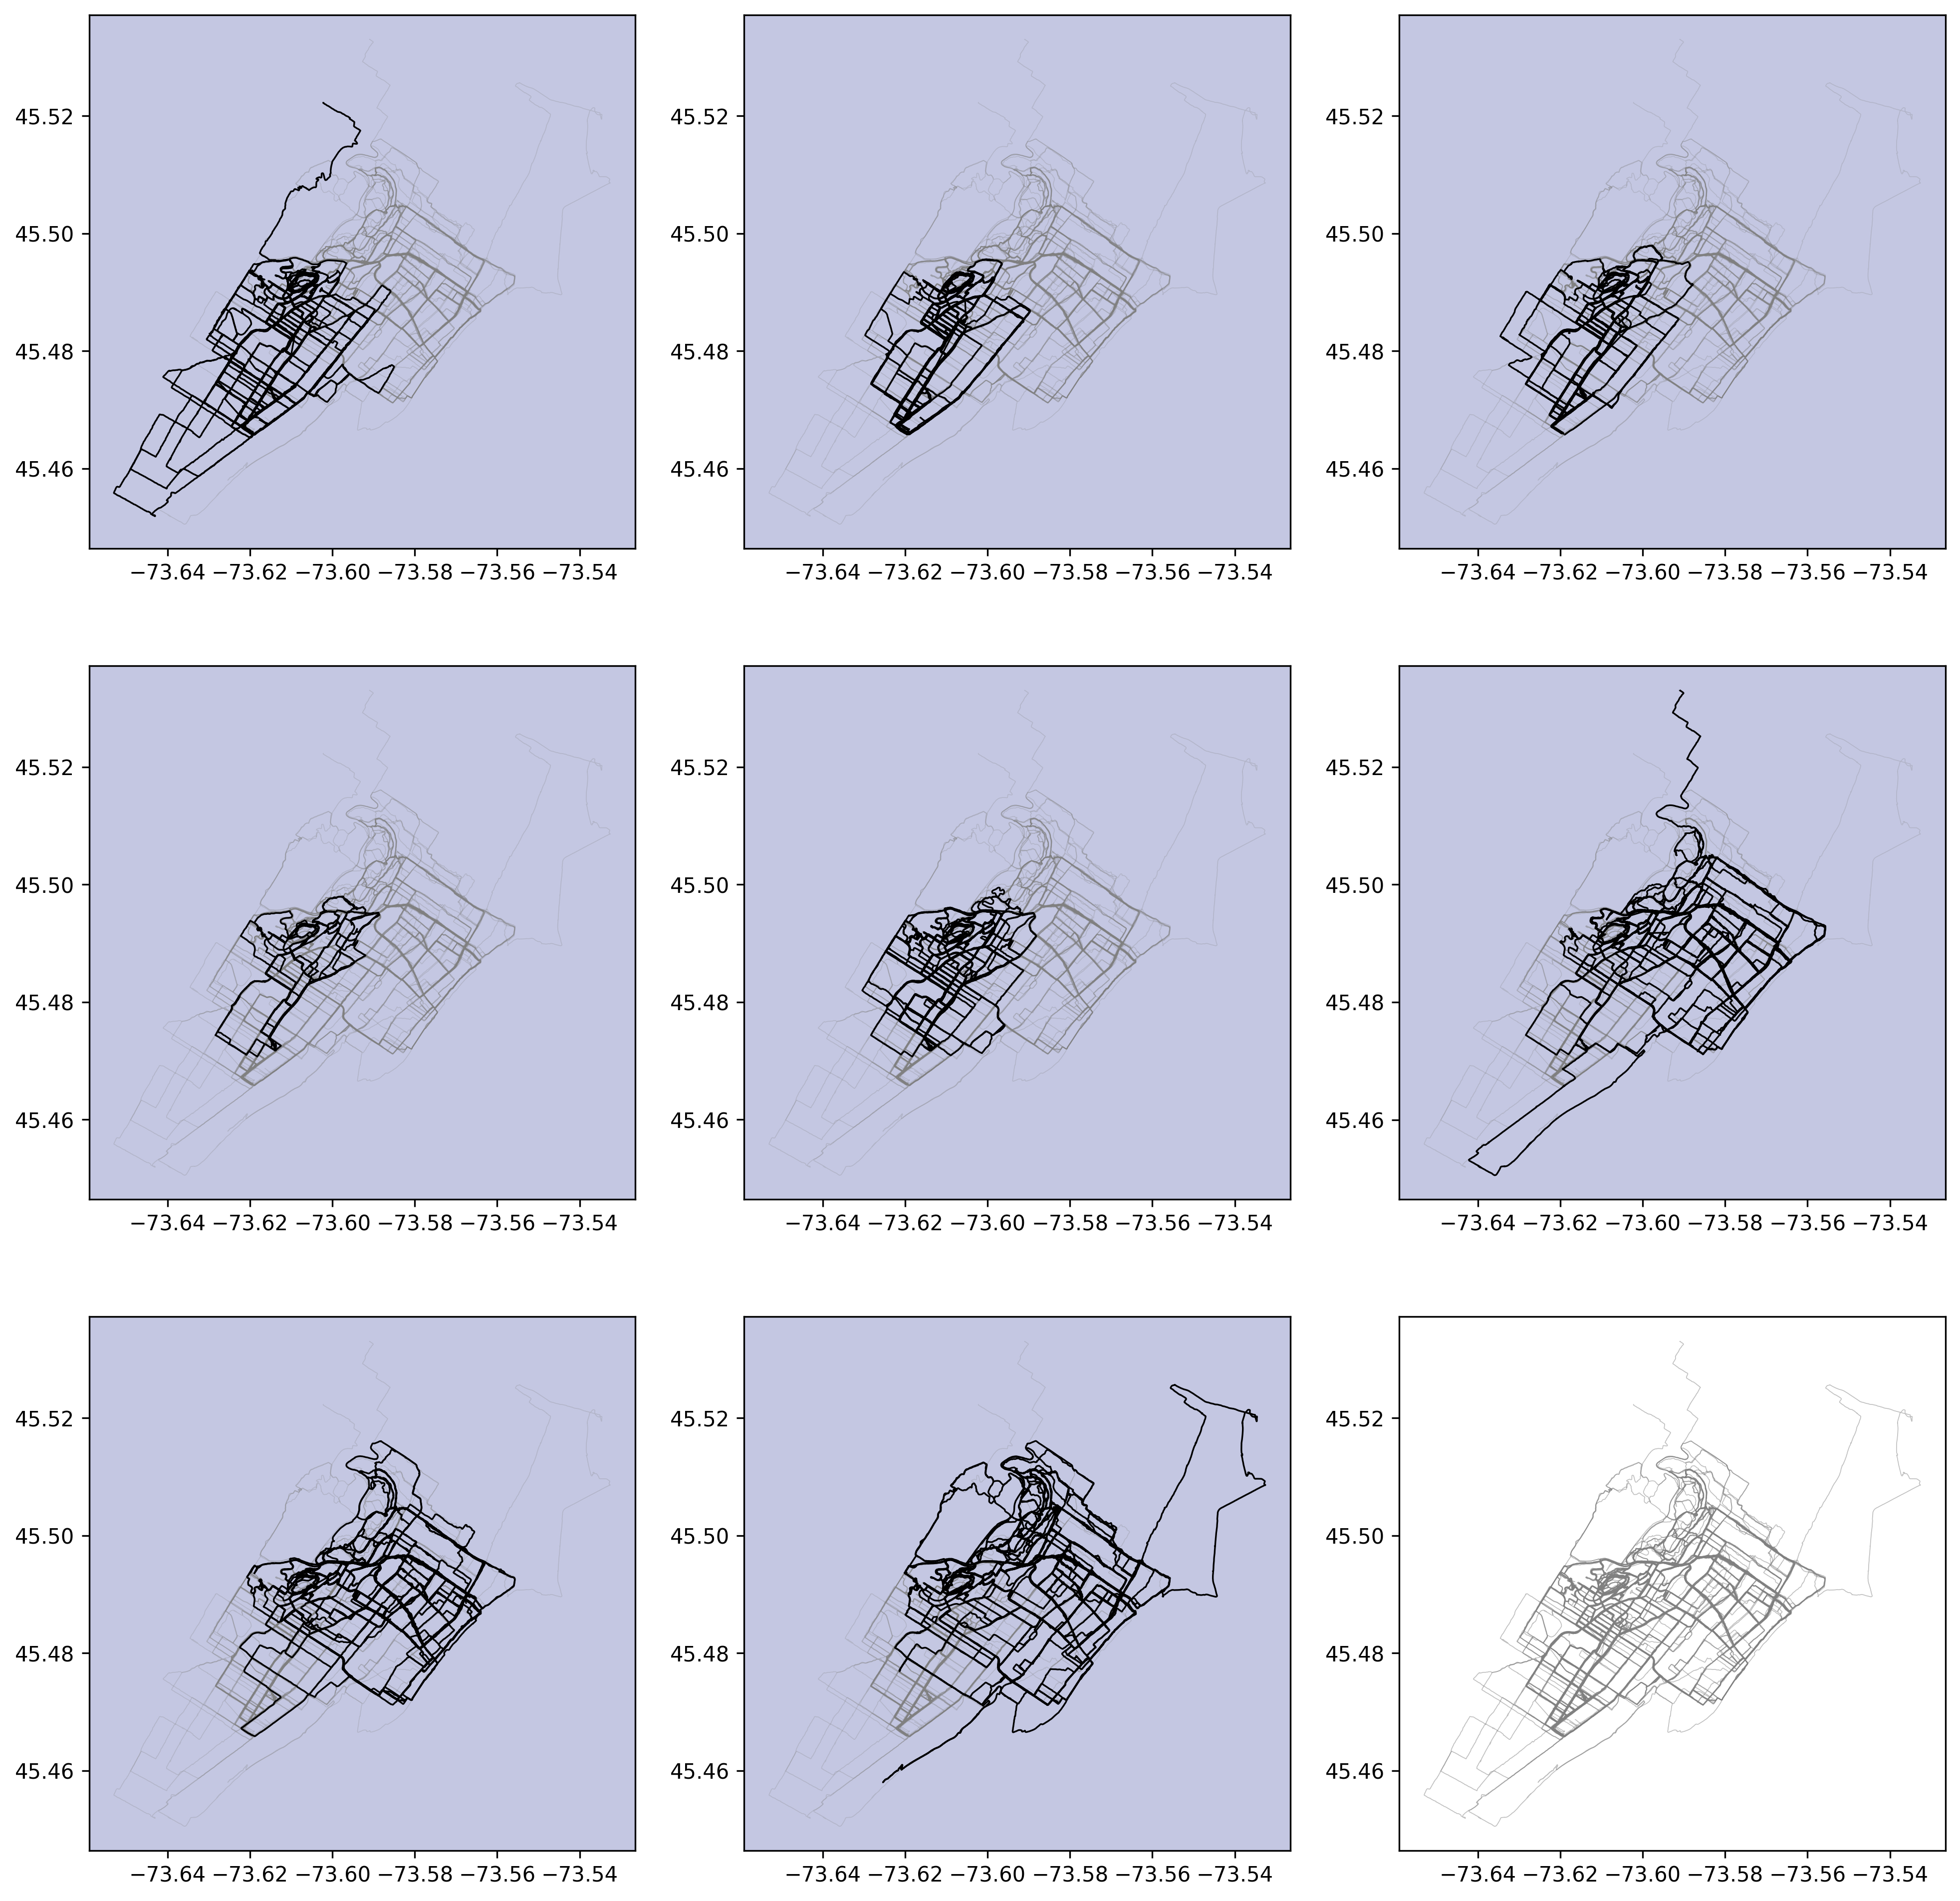
Similar graph combining all seasons, from top to bottom 2017 to 2025. It’s a wip graph.
Why did we run?
Absolutely no idea.
Behind the scene
As mentionned above it is not my first iteration on that project. The difference is now I can create my DB in a few lines of code, much less than the first attempt. It is also easier to update my DB as every week I have new data to add.
There is always something to improve. For exemple I have tried two functions from different modules to import data from gpx files and both don’t give me exactly the same values, I need to investigate that. I haven’t played much with elevation data and that’s probably the next layer of information to add to the graphs I have produced.
Finally it can be done live, in a sense it can be used to illustrate the life of this run club in a presentation, showing interactively where we went using the Python notebook.